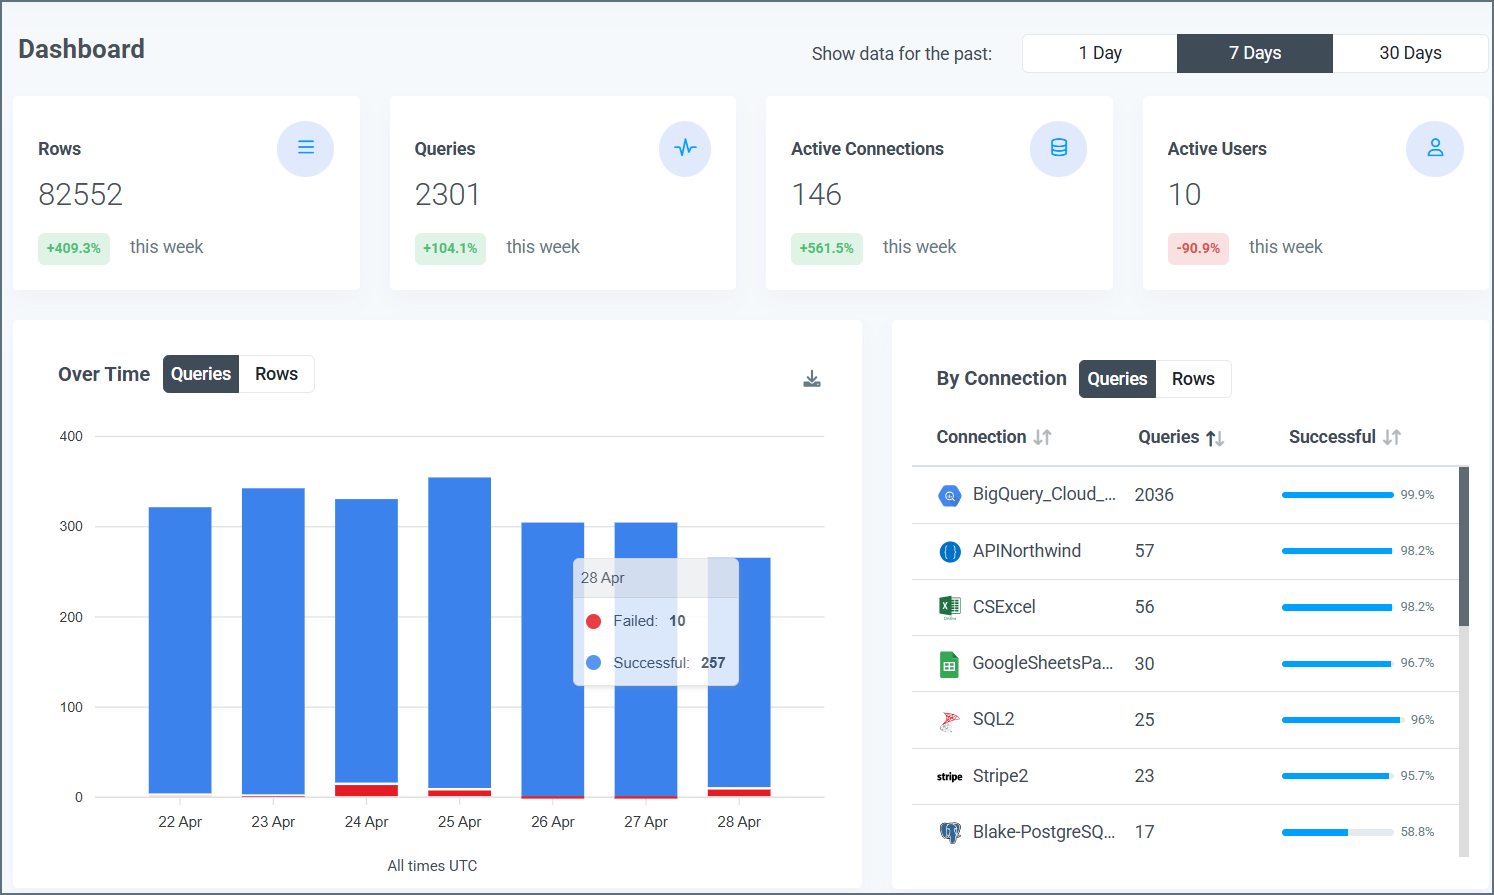
Information Boxes
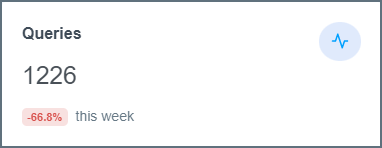
Information boxes at the top of the page display the quantity for each of these four categories in the selected time period:- Queries: The queries that are performed
- Rows: The rows that are processed
- Active Connections: The active connections on your account
- Active Users: The active users in your account
Data Visuals
Under the information boxes, the Dashboard page displays three visuals:- Queries Over Time
- Queries by Connection
- Queries by User
Queries Over Time
This bar graph shows the total number of queries that are made through your Connect AI account over the selected time period. The x-axis displays the dates, and the y-axis displays the number of queries.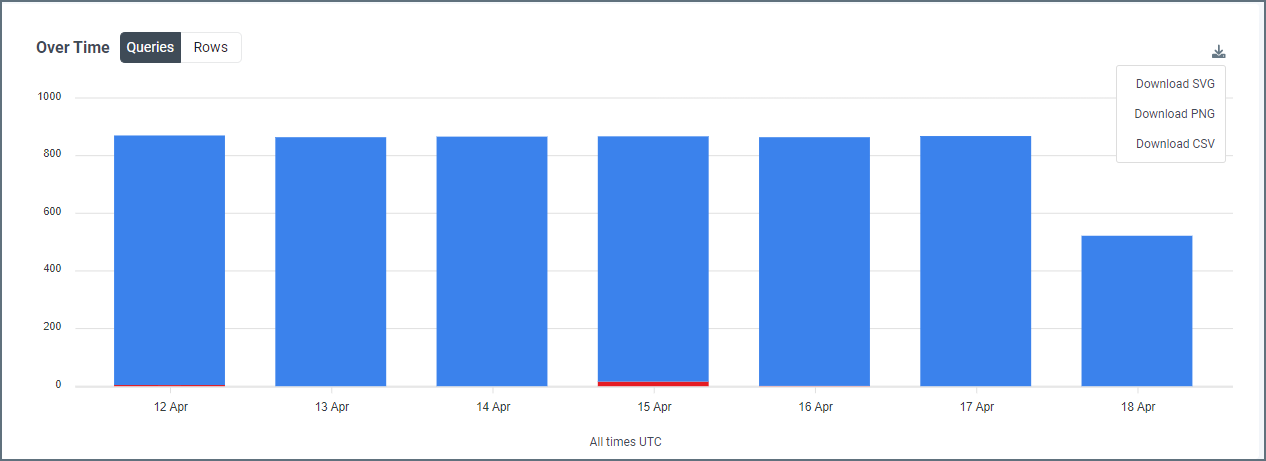
- The number of successful queries, displayed top portion of the bar and colored blue
- The number of failed queries, displayed as the bottom portion of the bar and colored red
Queries by Connection
This table displays the number of queries that are made by each connection in the selected time period.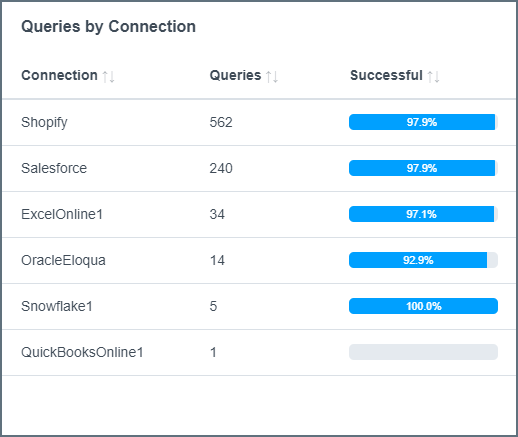
- Connection: The name that is given to the connection on the Connections tab
- Queries: The total number of queries, both successful and failed, that are made by the connection in the selected time period
- Successful: The percentage of queries from the connector that succeed in the selected time period
Queries by User
This table provides a detailed breakdown of the queries that are made by each user in the selected time period.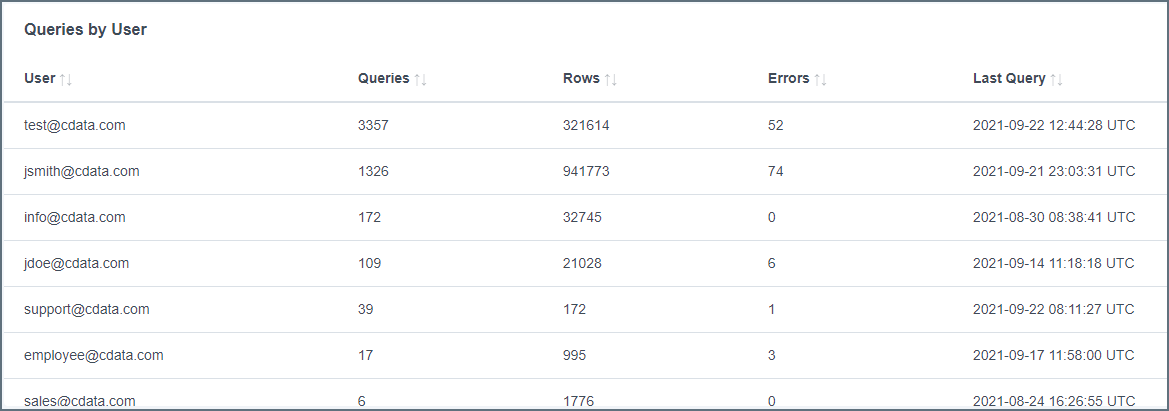
- User: The name of the user who performs the queries
- Queries: The number of queries that are performed by the user in the selected time period
- Rows: The number of rows that are processed by the user in the selected time period
- Errors: The number of failed queries for the user in the selected time period
- Last Query: The date and time of the user’s last query, formatted as YYYY-MM-DD HH:MM:SS UTC